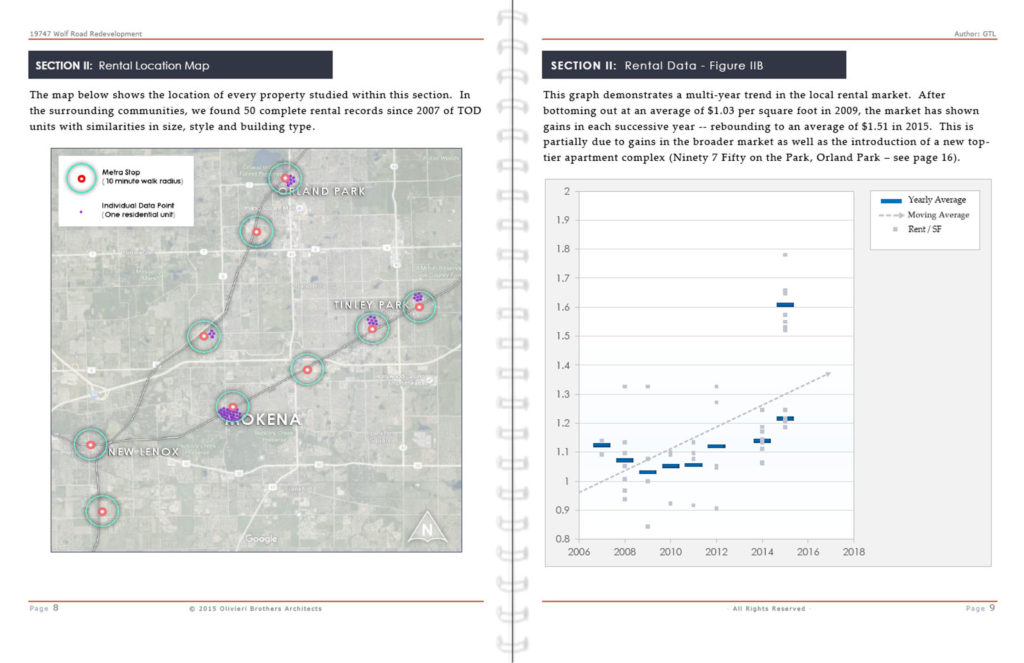
Data often requires visualization to generate meaning. Especially when considering proposal books will be read by many individuals coming from many different backgrounds. Clear and concise maps and graphs help make sure your data is understood by all readers exactly as intended.
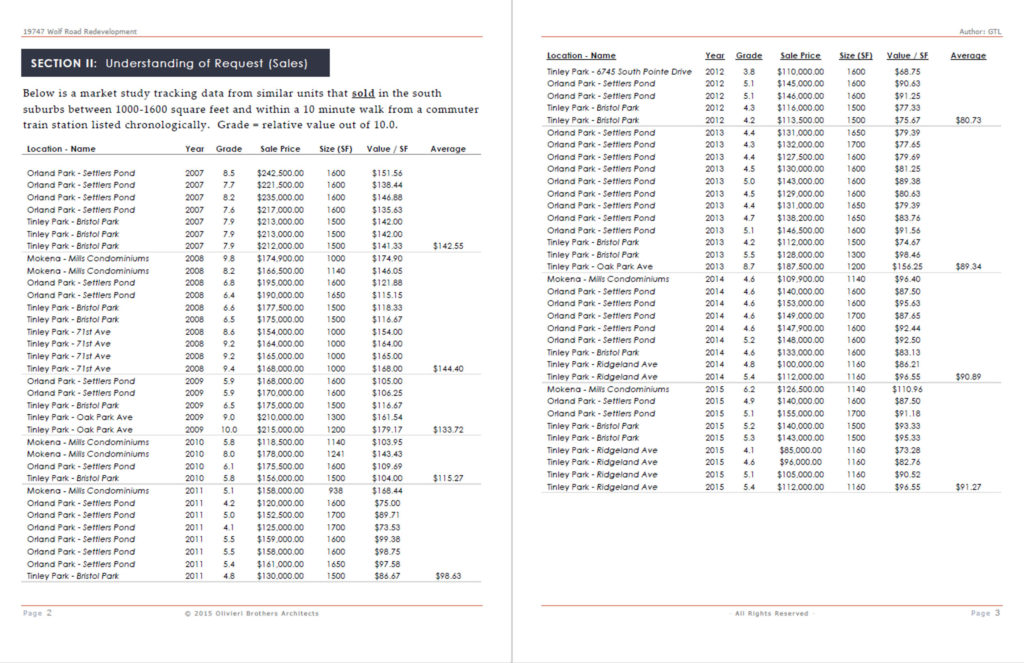
DATA TABLES
When I include data visualizations in a proposal book I always back them up with the raw material. And when doing so, it is still important to display the data table in an organized and legible format.
CREATE A NARRATIVE
As a small firm, responding to requests for qualifications often means competing against much larger organizations. In these situations I’ve found the most success weaving a unique narrative (that the bigger more qualified competition lacks) throughout the response book. The two page spread below is an example of one of these narratives.
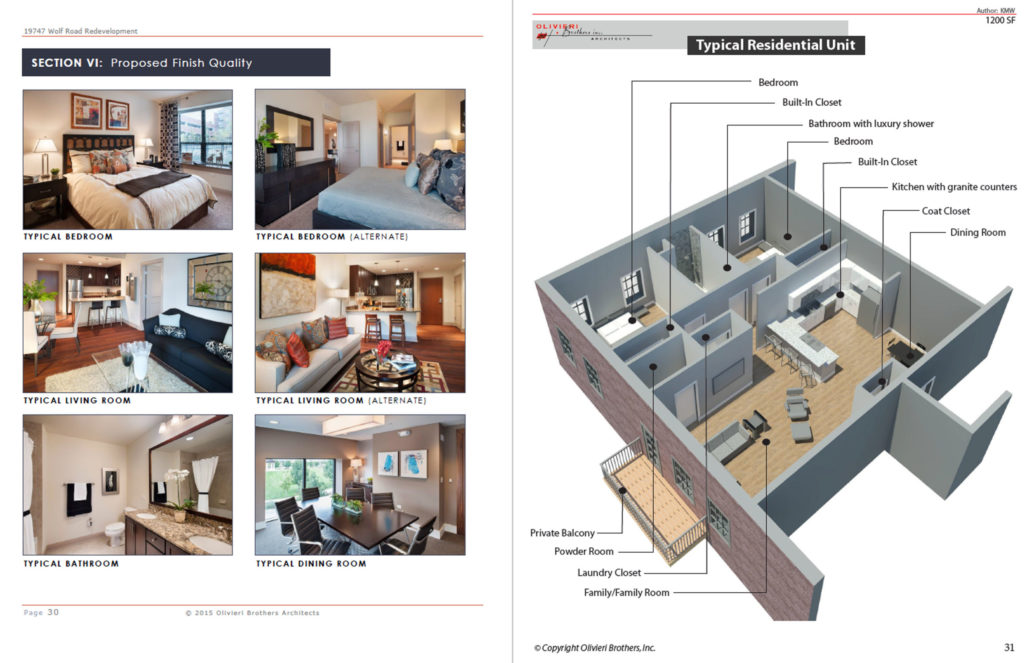
VISUALIZE SPACE
I find it helpful to mix media when communicating a design for a new space. In this case, I used a perspective rendering of a typical residential unit along side reference photography of similar spaces in the real world.
COMMUNICATE RELATIONSHIPS
Reference pages and organizational charts shouldbe as beautiful and thoughtfully composed as the rest of the proposal booklet. They also display essential information that should be easy to find and understand.